
 With earnings season ready to begin its second full week there are again some opportunities to identify stocks whose earnings may represent risk that is over-estimated by the options market, yet may still offer attractive premiums outside of the presumed risk area.
While in a perfect world good earnings would see increased share prices and bad earnings would result in price drops, the actual responses may be very unpredictable and as a result earnings reports are often periods of great consternation and frustration.
For the buy and hold investor, while earnings may send shares higher, this is also a time when paper profits may vanish and the cycle of share appreciation has to begin anew. Other than supplementing existing positions with strategic option positions, such as the purchase of out of the money puts, the investor must sit and await the fate of existing shares.
Occasionally, a covered option strategy, either through the sale of puts or buy/write transactions, may offer opportunity to achieve an acceptable return on investment while limiting the apparent risk of exposure to the large moves that may accompany good, bad or downright ugly news. Although a roll of the dice has definable probabilities, when it comes to stocks sometimes you want something that seems less predicated on chance and less on human emotion or herd mentality.
As always, whenever I consider whether an earnings related trade is worth pursuing I let the “implied volatility” serve as a guide in determining whether there is a satisfactory risk-reward proposition to consider action. That simple calculation provides an upper and lower price range in which price movement is anticipated and can then be compared to corresponding premiums collected for assuming risk. It is, to a degree based on herd mentality in the option market and has varying degrees of emotion already built into values. The greater the emotion, as expressed by the relative size of the premiums for strike levels outside of the range defined by the implied volatility the more interested I am in considering a position.
My preference in addressing earnings related trades is to do so through the sale of put contracts, always utilizing the weekly contract and a strike price that is below the lower range defined by the implied volatility calculation. Since I’m very satisfied with a weekly 1% ROI, I then look to find the strike level that corresponds to at least a 1% return.
While individuals can and should set their own risk-reward parameters, a weekly 1% ROI seems to be one that finds a good balance between risk and reward, as long as the associated strike level is also outside of the implied volatility range. If the strike level is within the range I don’t assess it as meeting my criteria. I sometimes may be less stringent, accepting a strike level slightly inside the lower boundary of the range if shares have already had some decline in the immediate days preceding earnings. Conversely, if shares have moved higher in advance of earnings I’m either less likely to execute the trade or much more stringent in strike level selection or expecting an ROI in excess of 1%.
While conventional wisdom is to not sell puts on positions that you wouldn’t mind owning at a specified price, I very often do not want to own the shares of the companies that I am considering. For the period of the trade, I remain completely agnostic to everything about the company other than its price and the ability to sell contracts and if necessary, purchase and then re-sell contracts repeatedly, until the position may be closed.
However, for those having limited or no experience with the sale of put contracts, you should assume a likelihood of being assigned shares and the potential downside of having a price drop well in excess of your projections. For that reason you may want to re-consider the agnostic part and be at peace with the potential of owning shares at your strike price and helping to reduce the burden through the sale of calls, where possible.
Since my further preference is to not be assigned shares, I favor those positions that have expanded weekly options available, so that there is opportunity to roll contracts over in the event that assignment appears likely using a time frame that offers a balance between return and brevity.
This week there are a number of stocks that will release quarterly earnings that may warrant consideration as the reward may be well suited to the risk taken for those with a little bit of adventurousness.
A number of the companies highlighted are volatile on a daily basis, but more so when event driven, such as with the report of earnings. While implied volatilities may occasionally appear to be high, they are frequently borne out by past history and it would be injudicious to simply believe that such implied moves are outside the realm of probability. Stocks can and do move 10, 15 or 20% on news.
The coming week presents companies that I usually already follow. Among them are Amazon (AMZN), Cliffs Natural Resources (CLF), Cree (CREE), Deckers (DECK), Facebook (FB), Gilead (GILD), Microsoft (MSFT) and Netflix (NFLX).
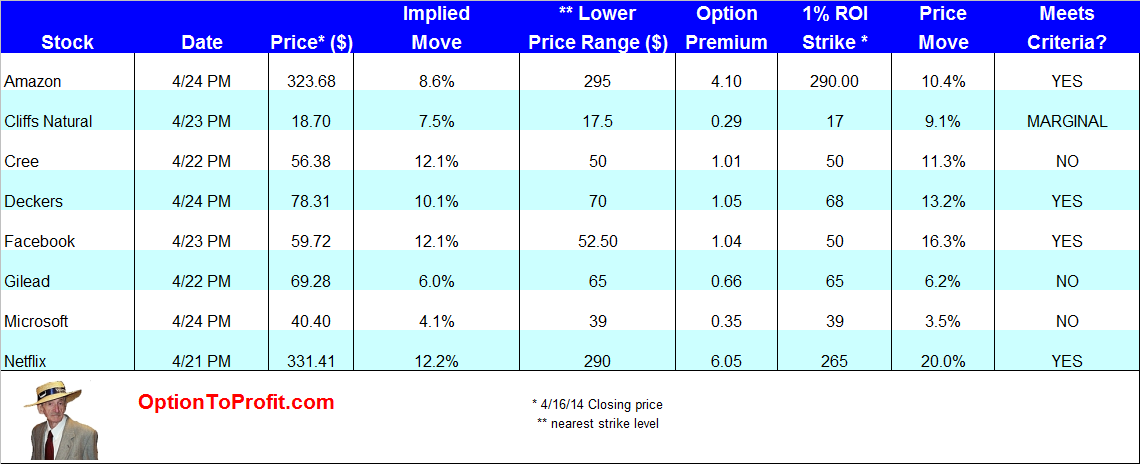 The table above may be used as a guide for determining which of these stocks meets personal risk-reward parameters, understanding that re-calculations must be made as share prices, their associated premiums and subsequently even strike level targets may change.
While I most often use the list of stocks on a prospective basis in anticipation of an earnings related move, sometimes the sale of puts following earnings is a favorable trade, especially in instances in which shares have reacted in a decidedly negative fashion to earnings or to guidance.
Regardless of the timing of the sale of puts, before or after earnings are released, being more pessimistic regarding the potential for price drops may be an enticing trade for the generation of income.
 (A version of this article appeared in
  While most of the more meaningful companies in the S&P 500 have already reported earnings and new earnings season is barely 7 weeks away, there’s still time to profit from remaining earnings reports coming this week.
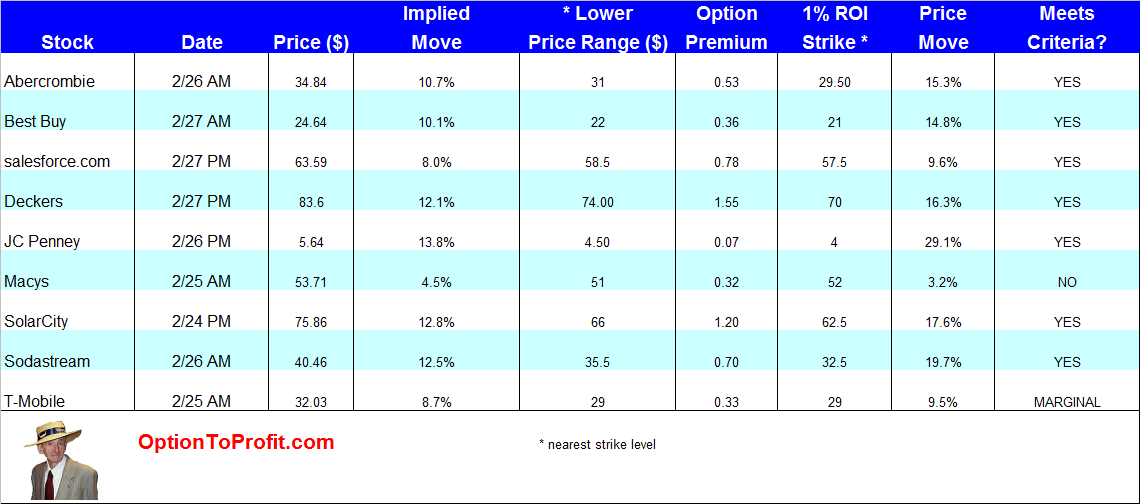


 (A version of this article appeared in


 (A version of this article appeared in
  As an example, I’m going to look at Petrobras (PBR) shares that I bought on January 7, 2013 at $20.05 and currently trading at $13.48. An advanced degree is mathematics is unnecessary to recognize that represents more than a 10% decline and would violate investing rules sometimes attributed to famed financier Bernard Baruch.
 It’s that time of the year to sadly sit and accept some reality and see if there are any strategic tax losses to offset trading gains. That is a gift in the tax code and just about the only thing that makes taking a loss palatable for me.
 As an example, I’m going to look at JC Penney (JCP) shares that I bought on July 30, 2013 at $16.16 and currently trading at $8.75. These values are not adjusted to reflect any option premiums collected. It doesn’t take a mathematics savant to know that is a loss well in excess of 10%. If Bernard Baruch were still alive he would slap me silly, as corporal punishment was still acceptable in his day.