The Clock is Ticking on the S&P 500

The age old question and certainly having its application in the stock markets is how does one see the glass. Is it half full or half empty? Is the market going higher from the current levels or have we already seen its best days?

I often like to say that I neither believe in technical nor fundamental analyses. Saying so is probably a reflection of the denial that has me refusing to believe that my intellectual capacity has greatly diminished.

While not really spending terribly much time with charts, I do glance at them. Like the spooky kid from “The Sixth Sense,” I do think I occasionally see patterns. I suppose to some degree that’s somehow related to a very basic aspect of technical analysis.

About a month ago, I started getting a bit leery about the market’s climb and have found it increasingly difficult to commit funds to new positions. That feeling was based upon what I perceived to be a very similar path that the market was following to that exhibited in the beginning of 2012.

Both paths are the kind that covered option sellers dislike, but fortunately don’t come along very often. Both times the market has essentially done nothing but climb higher.

This Thursday morning we’re fresh off closing higher nine straight days. In fact, March 2013 has yet to see a lower close. Needless to say, my prescience has yet to be fulfilled.

The last time that the market enjoyed a nine day winning streak was in November 1996 and it do so in May 1996, as well. I can say “enjoyed” because back then i wasn’t selling call options, so I’m fairly certain that I enjoyed those periods as well.

Out of curiosity and with an abundance of time on my hands as I await something to break in one direction or another, I was interested in seeing just how the market has done historically following such consistent daily climbs higher.

The short and quick answer is that such climbs in the S&P 500 or its related trading products, such as SPDR S&P 500 ETF (SPY) do not result in a reactive and sharp drop once the string of advances has come to an end. The market continues to climb.

So much for my theory and hopes that I could return to the more fulfilling days of trading ups and downs in the market.

While the current advance should, therefore, be a source of continued optimism, there may be a competing dynamic to be considered.

Looking at the bigger picture, beginning in May 1996, when that first 9 day advance occurred, which happened to be at the beginning of a secular market climb, it seems as if some kind of pattern was appearing.

Looking at the 17 year period illustrated above there may be some reason to believe that we are in the process of completing a 52 month cycle.

In each of the two previous broad and sustained market rallies the time frame has been approximately 52 months and the rallies have been on the order of 100% or greater. For those not chased out of the market as the nadirs were reached the recoveries were satisfying.

However, that satisfaction may have been tempered by the large market drops that ensued. In both previous cases the market plunged more than 40% over the course of the subsequent 18-30 months. Greed, optimism, a sense of invincibility may all have been factors in being caught in the continued downdrafts that devoured paper profits.

In hindsight, there were certainly precipitating factors that may have played a role in these drops, not all of which could have been predicted.

While perhaps the technology bubble should have been no surprise, nor should the real estate bubble, extrinsic factors, such as the terrorist attack of September 11, 2001 contributed to market declines during an already susceptible period. However, in the period from May 1996 to the present, there have also been an astonishing 18 periods of time when the market fell 10% or more.

As hard as it is to understand that the occasional fire that burns down a beloved forest is part of a cycle that sustains and evolves the environment, so too are those market declines an apparently necessary, or at least unavoidable component of reaching greater heights.

Clearly, and again, focusing on the big picture, those intermediate declines have been part of a healthy process as the S&P 500 has appreciated by more than 130% since that nine day trading range in 1996. Of course, that’s little solace to those that did see their profits disappear and that may have exited the market and greatly delayed their re-entry.

Being prepared for those declines is the tricky part. Balancing the need to be invested with the knowledge that much of your good work can be undone by a simple hiccough is disconcerting.

As we are now in the fifth year of the current climb and may be appro
aching that wall that we’ve seen twice before in the past 17 years, I continue to believe that there is ample reason to create reserves and take profits, even if that means leaving some on the table. Transitioning a portfolio may be a good strategy to gradually respond to future uncertainty.

In my case, that means being less likely to rollover covered contracts into the next cycle and instead being happy to see share assignments and realization of cash proceeds. It may also mean writing longer term contracts for those positions not likely to be assigned and grabbing larger premiums, albeit at lower time adjusted ROIs, in order to have a better chance of riding out any reversal.

Timing the market is something that most sane people would agree is impossible, certainly on a consistent basis. Everyone has the same charts to look at, yet the interpretations are in a wide range, often fitting personal outlooks and human emotions. The cynic and the optimist see the same data very differently and respond consistent with their own biases.

I am, by nature, a long term optimist, but a short term pessimist. Rarely, however, have I felt this level of pessimism. Sadly, I didn’t feel it in 2007, even after first having one of those warning mini- drops of 8% in July 2007.

The nice thing about being wrong is that you can always get back, although given that scenario, I have to believe that I would be even more pessimistic, as I don’t care to chase stocks as they’ve moved higher.

The other nice thing is as today (Thursday March 14, 2013) is thus far shaping up to be the 10th straight day of gains, I can look at the data all over again and perhaps arrive at a completely different conclusion.

Just like the professionals.


Google is a Bargain

How many times have you heard the expression that “everything is relative?”

Certainly, when it comes to the price of anything, on some level a determination is made of its relative value. It can be a complicated process combining objective and subjective measures and is often re-assessed in hindsight.

That latter part is especially true with stock purchases. Buying and selling stocks that should be a simple exercise as you don’t really need to deal with intangibles, such as emotion, fear and the specter of a collapse of the Euro. At least not if you believe that the P/E ratio is a fair measure of value and a simple means by which to make comparisons. It would also helped if absolutely everyone agreed with you in that regard.

Barely a year ago it seemed as if all attention and all excitement was focused on Apple (AAPL) and what kind of price targets it could breach in its unstoppable ride. How often did analysts refer to Apple’s price movement as something unique and special?

As Apple is now having some difficulty living up to those lofty expectations it really shouldn’t come as much of a surprise that it has hit a wall faced by other invincibles of past. Being unique and special is not all that unique if history is a guide. I did my best to suggest that in a number of Apple-centric articles in the past 6 months. While history suggests that Apple will fall even further it gives reason to suspect that Google will march significantly higher.

Let’s go to the charts.

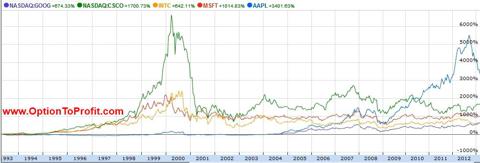
Just look at what happened to some of its sector mates about a dozen years ago. Whether Cisco (CSCO), Microsoft (MSFT) or Intel (INTC), their charts all look very similar. Although the 200,000% increase in shares of Cisco at its peak may be an outlier, Microsoft experienced a 57,000% climb, while Intel and Apple had 18,800% and 21,400% increases from their opening day close trades.

While Cisco, Microsoft and Intel all experienced their high points during the technology bubble, Apple waited the same dozen years to begin resembling the pattern of its Silicon Valley neighbors. Coincidentally, that was the length of time that Steve Jobs was estranged from Apple, before his return following the purchase of Next Computer by Apple.

By the standards of a decade ago, Apple’s share price may still have some way to go to match Microsoft’s 60% drop, Intel’s 74% retreat or Cisco’s 76% plunge. Thus far, with its recent low of $420, Apple has fallen 40% from its 2012 peak. All you need to do is slide its representation on the charts above or below over to the left 12 years and see how nicely they superimposes with the others.

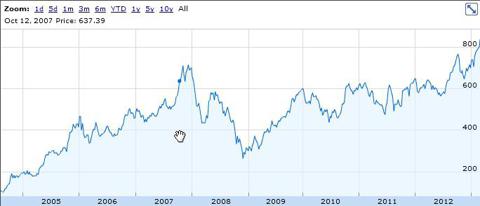
But then there’s Google (GOOG). The company that’s feared, has moved into everyone’s space, is willing to fail, yet somehow garners little respect and attention. Even as it achieved its trading highs, surpassing the $800 level, analysts downplayed the achievement. Instead of discussing the juggernaut that Google is and its expansive vision, the price increase has widely been attributed to people trading out of Apple and into Google. Those are the same people that downplay market rallies by saying that it occurred on light volume. If your banker doesn’t ask about the white powder on your deposits, they’re not likely to ask if they were the result of light volume.

Google simply isn’t really generating the same kind of excitement as Apple did just a year ago. No one has even thought Google deserved an utterance of the “Law of Large Numbers” as a reason why it would have difficulty in continuing its climb.


Granted, Google didn’t start it’s first day of trading as a sub-$10 stock, so it is a bit more difficult to achieve a 200,000% gain. To do so, its share price would have to advance to approximately $200,000, although it could conceivably split its shares on the order of the 288 fold times that Microsoft has done. While Cisco only had to climb to $22 to increase its share price 100% after it opened for trading, Google had to climb $108 for that distinction. At $838 it is currently up less than 700% from its closing trade on its IPO day in 2004.

700%? That’s nothing by relative standards. That is the poor section of Atherton, barely even good enough to step foot into Palo Alto. Besides, even Johnson & Johnson (JNJ) was able to mount that kind of appreciation in a nine year period beginning in the mid-1980s. By historical standards there’s nothing rarefied about Google’s performance.

Certainly, by no relative measure is Google over-extended. Further, Google’s mettle has been tested and it has shown its leadership qualities. Although Google fell more than the others during the market meltdown beginning in 2007, its descent started later and ended earlier. In fact, Google started its climb back more than three months before the market bottom, having advanced more than 40% in those months preceding the market nadir.

While Apple had out-performed Google in both the periods from the October 2007 peak and the March 2009 bottom, Google has handily beaten the others.

Google’s most recent advance began November 15, 2012, moving forward 20.3%. Coincidentally, the S&P 500’s march higher (13.6%) began on November 15, 2012.

Yet the Google chart looks nothing like that of its one time glorious and subsequently fallen neighbors.

 At this point all it has done is to return and mildly surpass its 2007 peak price.

Once ad click money truly started flowing in Google has always taken the opportunity to try new and exciting ventures, most of which have been scuttled or perpetually stayed in beta. While small in the scope of the enormously growing enterprise, under the leadership of Larry Page the ventures are increasingly bold and increasingly poised to create meaningful revenue streams in addition to the growing annuity that ad click revenue has become. Even if no meaningful or immediate direct revenue is recognized from a venture, Google is a disruptor in the market place and is able to soften the underbelly of a potential competitor. Just ask Apple.

With a growing cash horde and a dividend in its inevitable future, Google has already one upped Apple with its proposed, albeit controversial, stock split. Arguably, the series of stock splits that Microsoft, Intel and Cisco undertook helped to fuel their stock appreciation and Google is still on the ground floor in that regard, standing to benefit from the illusory increase in value.

Most of all, Google is still such a relatively young company that is just learning to walk. Granted, it is doing so during a very different era than did its counterparts, but even by Apple’s modest 18,000% growth, which was not artificially fueled by the technology boom, Google has plenty of room to still return incredible profits to new investors, if it follows the script that has been played out by others.

Finally, I would be negligent, and certainly not mindful of my own history, to not suggest that there are covered option opportunities always available with Google. Although I do not currently own shares, Google has been a frequent source of premium income for me over the past 6 years. With extended weekly options now available as well, there are many choices among strike prices and contract length that both price bulls and bears can find appealing. Even those thinking that there may be no more than an 8% drop by April 20, 2013 can get a !% ROI for their pessimism. For those with a tighter price range the rewards can be substantial if Google stays within that range.

Google is also always an exciting play upon earnings announcement. Of course the premature announcement of two quarters ago was more excitement than many would want to repeat, especially, RR Donnelley (RRD), but Google is a frequent candidate for the “Premiums Enhanced by Earnings” strategy, either through covered calls or put sales, whether its shares move up or down. Seeking to take advantage of its historically large earnings related moves may be a good, and fairly conservative mechanism to find an entry point for those not currently holding shares.

I’ll be looking forward to earnings on April 15th and hope to be in a position to pay a fair share of taxes on the profits the next April 15th.

Gloom Can Bring Good TImes

I often say that I neither believe nor follow fundamental nor technical analyses.

Maybe that’s because I’m incapable of understanding or learning the nuances of either. However, despite saying such, like so many things in life, the truth usually lies somewhere in-between.

I do look at charts, although I’m not entirely convinced that I know what I’m looking for or looking at when I stare at the graphic representation of what we observe in the market. On some primitive level I must be doing some kind of technical analysis because I do look for patterns, such as that mentioned about 9 months ago in how Apple (AAPL) was resembling the Google (GOOG) of 2008.

As someone who has been consistently selling options for more than 5 years, I can look at specific periods of time when those who criticize that technique would have been able to revel in their tremendous insight and understanding of price movements, while I would have been wallowing in introspection.

Luckily, that introspection never seems to last for very long.

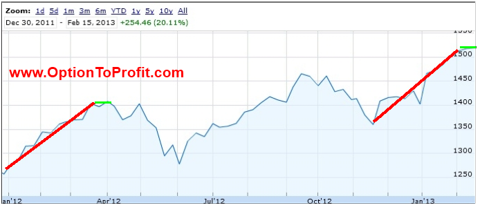
One such period was from January 1, 2012 to mid-March 2012. One real characterization of that period, besides the seemingly higher close each and every day was the manner in which it happened. Coming immediately after the close of trading in 2011, a year in which triple digit moves in either direction were the norm, that initial period in 2012 was quite different. Those moves were rare. Instead, it was the same slow melt-up that we’ve witnessed thus far in 2013.

I’ll add the first 6 weeks of 2013 as a period that I haven’t been fully enamored of having sold options, although to be fully analytical, I’d have to admit that stock selection plays a role, as well. On paper, the adverse impact of Petrobras (PBR) and Cliffs Natural Resources (CLF), have to be given their due credit.

But looking back to 2012, it all just suddenly changed and made me feel much better about the strategy of selling options. It all started with those triple digit moves. Just as quickly, introspection gave way to a sense of high self-esteem.

As 2013 has been thus far following the same pattern, I’m beginning to see the light at the end of the tunnel.

Again, I’ll certainly admit to a very simplistic use of charts, but just as the charts of Apple and Google at different periods in their corporate lives looked remarkably similar and portended a future path for Apple, I am struck by the similarity in the slopes of the S&P 500 (SPY) for the two periods mentioned earlier.

Qualitatively, I could tell anyone how similar those periods were, without looking at any chart, owing to my trading results. However, the parallel slopes tell a more compelling and quantitative story. Beyond that, the time periods are identical. In the case of 2012, the ascendant period was followed by a brief two week flat period, which was followed by a quick 2% market drop. That drop was just as quickly erased, restoring investor confidence long enough to go through a 1 month and 8% decline.

On this President’s Day, coincidentally we are just concluding a two week period of calm and flat performance, with the S&P 500 having moved 2 points in that period.

There’s certainly no rule that I know of that insists that events repeat themselves. In this case, looking back at my 2012 results, I certainly hope that they do, as it is always preferable for the covered option seller to be doing so in a flat or down market.

Of course, a rational mind will ask what the stimulus might be for a market reversal or any large move regardless of direction. Whereas individual stocks may not require a publicly known stimulus to have a large and sudden move, the market itself needs some overt catalyst. Back in 2012, perhaps it was news of a double dip in the Spanish economy or Greek elections that turned out austerity. Who really knows?

On the horizon, the only known entity is the “sequester.” However, it’s really anyone’s guess where its current deadline for resolution may take us. The recent “Fiscal Cliff” was rationalized by many as being the impetus for the gains of 2013, but it’s not clear to me what effect the sequester may have, regardless of political agreement, or not. Any reduction in spending would be a positive and I believe that the market, which is still rumored to discount events six months into the future, is expecting some kind of resolution.

With less than two weeks to go for the clock to stop ticking, it’s hard to imagine the market being propelled forward on any agreement. Of course, it’s certainly easy to see how another delay or “kick of the can down the road” could be unsettling, especially to credit markets. Standard and Poors may have their own headaches right now with issuance of past credit ratings, but they still do have a job to do.

While politicians may avoid the risk of being labeled “unpatriotic” for voting in favor of defense cuts, they free themselves of that charge if no agreement is reached by March 1,2013, which is just in time for a repeat of 2012.

If I were very concrete and believed that we must stick not only to the same pattern but to the same time frame, I would paint a scenario that envisions a quick 2 week sell off while some gloom sets in regarding agreement on the sequester. That, of course, would have to be followed by another 2 week period, but this time rebounding as it appears that positive movement is occurring.

That brings us to the deadline and the charting anniversary for a large market drop as either there is agreement or there is no agreement.

Win-win, especially if you’re a covered option selling politician.


Collecting Crumbs

 It’s that time of the month again.

No, I’m not being visited by Aunt Flo, as the euphamism would go, if indeed it were germane.

CrumbsNo, it’s the end of yet another options cycle in just a few short days. Time to see if there are any crumbs left out there just waiting to be taken. And you do have to act quickly, because before you know it those crumbs get smaller and smaller, before they disappear entirely.

I suppose that since I now try to find as many weekly options opportunities as possible, that third Friday of each month has lost a bit of its significance. Now its more or less like any other Friday.

I’ve never had a visit from Aunt Flo, but I can’t imagine that her dropping by on a weekly basis would be very good.

In a way, I guess that’s as sad as when you know that Aunt Flo won’t be visiitng anymore. Fortunately, that single long hair on my chin that popped up after Flo disappeared is obscured by my full beard.

By the same token, most people I know no longer deal in euphamisms, anyway. They get right down to brass tacks, no sense beating around the bloody bush.

Hmm, now I’m not certain if the preceding itself was a euphamism for something, but no matter, I just like using uniquely British adjectives.

Since options premiums keep me afloat, I have a need to trade, but times like these offer the biggest dilemmas. Those times are when I have shares that are at a paper loss and haven’t had option premiums written on them for the most recent cycle, whether weekly or monthly.

Holding on to so many positions that are significantly below their purchase prices, it’s hard to justify trying to optimize options premiums by writng near the money contracts when their assignment would result in meaningful capital losses.

Although I always check my spreadsheets to see how much in accumulated premiums each position has captured, I still have a reluctance to take the loss by selling a near the money option, even when it is mitigated or even fully offset by those premiums.

I’m not beyond rationalizing my actions, though.

But when you see the clock ticking away on the one hand, you also see the possibility of that silver lining in depressed stock prices, or at the very least the lack of support in silver prices, as I sometimes own unhedged shares of an UltraShort Silver ETF.

Will there be some good news coming out of the European Union sending our markets for a nice climb? I sure wouldn’t want to miss out on recouping some of those paper losses, but those crumbs, those 0.5% options premiums, do I really want to leave those on the table?

The answer to those questions are “who knows” and “not really”

The full answer to the latter question is actually “not really, but I don’t want to feel like a schmuck”.

But you do have to eat, you can’t really let pride get in the way. As small as they may be, those crumbs can add up.

And so, in a measured reaction to a meandering day, I often take the opportunity to scrape some last remaining crumbs, by seling options with just a day or two left until their expiration.

I want those premiums, even if their just a matter of pennies.

Pennies count.

The risk you take when taking crumbs, trying to milk every last penny out of an under-performing position is that there will be a wild, completely unexpected explosion to the upside in the hours that remain on the contract.

Opportunities potentially lost. That ends up being the performance metric, but since I don’t harbor regrets, I also rarely learn lessons. You can fool me over and over again as long as those premiums add up and losses have some strategic value in reducing tax liability.

When I did add the crumbs up it was worth the risk, given the reward and the need to be able to feed Laszlo the Dog.

It’s either crumbs or go back to work, not to mention the shriveled carcass of a wiener dog.

Hmmm. Weiner dog.

If anyone reading this is old enough to remember Bob Denver’s character, Maynard G. Krebs, you would know my reaction to the very thought of “work”.

So wherever and whenever you can get those crumbs, get them.

Tomorrow? Who knows what tomorrow brings. New rumors, maybe some actual news, maybe not.

No matter. The week always ends in a few days and a whole new world of opportunities comes along.

And with each week you can hope for the whole loaf and gladly take the crumbs, too.